
Table Of Content
Bricks is an AI-powered platform positioned to simplify the process of creating spreadsheets, presentations, reports, charts, and other visualizations directly from your data. Be it team management, project organization, or analysis of complex data, Bricks assists a user in converting raw information into polished graphically appealing outputs with a minimum of effort. The main selling point of the platform was its AI assistant, which automated tasks like building reports or charts on command, thereby making it a pretty useful tool for anyone who had to deal with data-heavy workflows.
What are the best Bricks features?
Bricks shines for its outstanding speed in generating visuals such as org charts, Gantt charts, dashboards, and timelines from spreadsheet data. You also will not need to start from scratch or be some kind of spreadsheet ninja, because all that heavy work is done by AI for you. Collaboration features include multi-user document editing to make sure teams stay in sync. It’s especially good for project management, sales tracking, and team organization.
How to use Bricks AI?
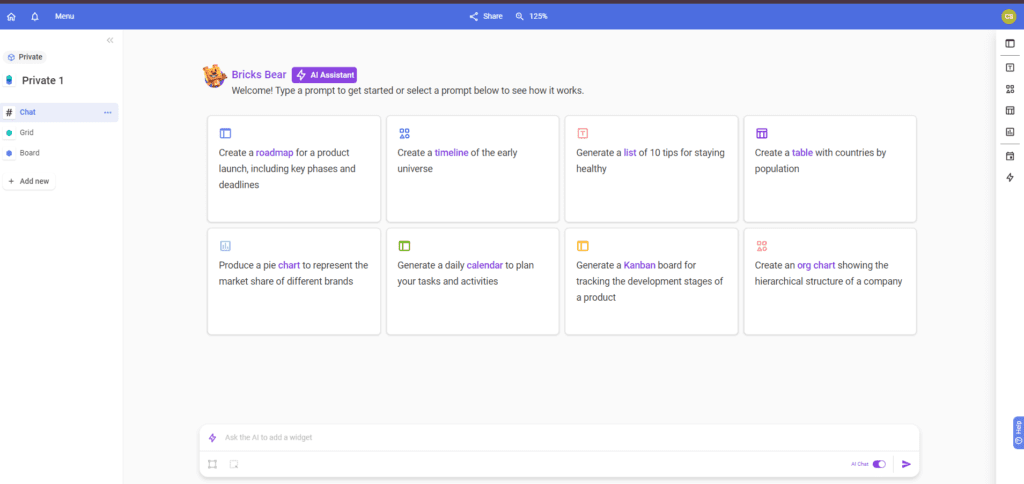
The way to get started with Bricks AI is by first creating an account on their website and logging into the platform. Data is imported into the tool through a provided upload interface, or through third-party integrations, such as spreadsheet integrations or direct database integrations. Visualizations, like charts or org charts, are created by describing in words what you want to see-for example, “Create quarterly sales report.” Bricks uses AI to automatically make the requested visual, using your data, in just a few seconds. You will also be allowed to personalize the visualizations further, either using prebuilt templates or through layout and formatting settings. Real-time collaboration within the platform means you can even invite your team members to work together on the platform and share documents by live links.
In our test run we generated a list of the top 10 tips for staying healthy:
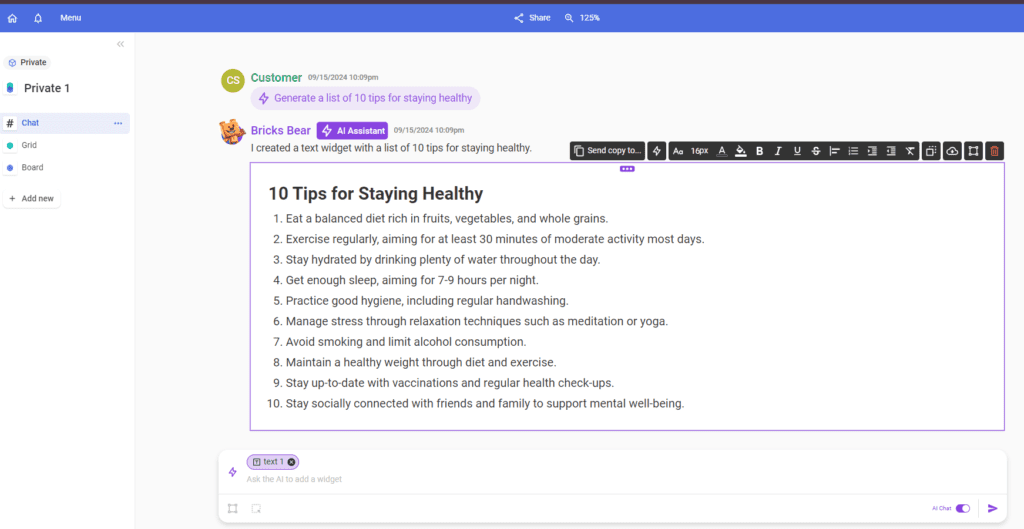
This platform works quite well, it is responsive, well designed and professional.
Pros:
- Ease of Use: You can describe what you want, and it generates the required output in seconds. The intuitive interface ensures that users of all skill levels can engage with the platform effectively.
- Collaboration: Bricks AI makes it simple to collaborate on charts and documents with team members. The ability to update charts in real-time and share them via link speeds up decision-making and alignment.
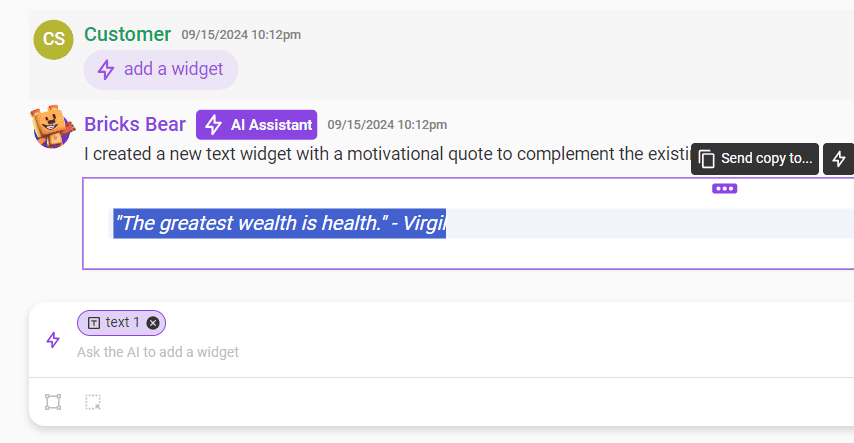
- AI-Powered Visuals: Automating visual creation helps users avoid repetitive tasks, freeing up time for higher-value work.
- Customization: Whether you need dashboards, charts, or tables, itoffers various templates and design options, making customization a breeze.
Cons:
- Learning Curve: Although easy to use, users unfamiliar with AI-assisted platforms might take time to fully understand its capabilities.
- Limited Offline Access: Bricks heavily relies on cloud functionalities, which might be a limitation for users needing offline capabilities.
Pricing
Bricks offers a free plan with limited features, ideal for small teams or individual projects. For larger teams and more complex data visualization needs, premium options unlock additional features such as advanced collaboration tools and enhanced AI functionality.
Use Cases
- Project Management: Generate timelines and Gantt charts to track project phases and keep teams aligned.
- Team Organization: Create org charts that clarify team structures and responsibilities. The AI can even update the charts when there are personnel changes.
- Data Analysis: Whether it’s for finance or sales, Bricks helps turn raw numbers into insightful reports and presentations that guide decision-making.
FAQs
1. How easy is it to create charts using Bricks AI? Creating charts with it is as simple as entering your data or even copying and pasting it into the platform. Once the data is in place, describe the type of chart you need, and the AI takes care of the rest. It’s designed to minimize the manual labor associated with data visualization.
2. Can I use it for collaborative work? Yes, it supports collaboration. Multiple team members can work on documents simultaneously, and sharing charts or dashboards with a live link ensures everyone is on the same page.
3. What kind of visuals can I generate using Bricks? it allows you to create a wide range of visuals, including org charts, Gantt charts, project roadmaps, and dashboards. It integrates AI to make these processes as smooth and intuitive as possible, even for users with minimal technical knowledge.


Leave a Reply
You must be logged in to post a comment.